Facebook
Instagram
Linkedin
Twitter
Bluesky
Sign in
Specific Needs
ADD & ADHD
Autism & ASD
Cerebral Palsy
Down Syndrome
Dyslexia & SpLD
Dyspraxia
Emotion & Behaviour
Hearing Impairment
Learning Disability
Literacy
Numeracy
OCD
Profound, Complex PMLD
Sensory Impairment
Speech & Language
Tourettes
Visual impairment
Care
Attachment
Children in care
Fostering & Adoption
Medical
Diabetes
Epilepsy
Healthy Lifestyle
Spina Bifida
Undiagnosed
Mental Health
Mobility
Manual Handling
Transport
Respite & Holidays
Safeguarding
Social & Relationships
Education
Alternative Provision
Bullying
Inclusion
Post 16/18
Recruitment
School Management
School trips
Days out
Schools
Teaching
Transition
Activities
Complementary Therapy
Creative Arts
Retained primitive reflexes
Learning outside the classroom
Multi-sensory
Music & Arts
Outdoors
Play
Relaxed Performance
Sport
Advice
Adult life with SEN
Books
Education plans
Families’ Rights
Law
Parenting
Support
Training
Tech
Assistive Technology
Communication Aids
ICT
Immersive technology
Resources
CPD and Events
Contact
Newsletter
Subscribe to SEN Magazine
Sign in
Welcome!
Log into your account
your username
your password
Forgot your password?
SEN Magazine privacy policy
Password recovery
Recover your password
your email
Search
SEN Magazine
The UK's leading magazine for special educational needs
Specific Needs
All
ADD & ADHD
Autism & ASD
Cerebral Palsy
Down Syndrome
Dyslexia & SpLD
Dyspraxia
Emotion & Behaviour
Hearing Impairment
Learning Disability
Literacy
Numeracy
OCD
Profound, Complex PMLD
Sensory Impairment
Speech & Language
Tourettes
Visual impairment
Dyslexia & SpLD
CReSTeD
Dyslexia & SpLD
Dyslexia and exams
Dyslexia & SpLD
Framing
Down Syndrome
Ruby flew too
Care
All
Attachment
Children in care
Fostering & Adoption
Medical
Diabetes
Epilepsy
Healthy Lifestyle
Spina Bifida
Undiagnosed
Mental Health
Mobility
Manual Handling
Transport
Respite & Holidays
Safeguarding
Social & Relationships
Respite & Holidays
Short breaks
Attachment
Intensive Interaction
Safeguarding
Child to parent abuse
Mobility
Freedom to pain and back again
Education
All
Alternative Provision
Bullying
Inclusion
Post 16/18
Recruitment
School Management
School trips
Days out
Schools
Teaching
Transition
Post 16/18
Building pathways before sixteen
Post 16/18
Step change
Schools
Do your homework
Days out
A grand day out
Activities
All
Complementary Therapy
Creative Arts
Retained primitive reflexes
Learning outside the classroom
Multi-sensory
Music & Arts
Outdoors
Play
Relaxed Performance
Sport
Multi-sensory
Sensory processing
Activities
A taste for adventure
Relaxed Performance
The play’s the thing
Relaxed Performance
Anything goes
Advice
All
Adult life with SEN
Books
Education plans
Families’ Rights
Law
Parenting
Support
Training
Books
Neurodiversity in the Early Years:
Books
The Parent’s Guide to SEND
Books
It’s Never Just About the Behaviour
Books
Understanding and Using Challenging Educational Theories (2nd Edition)
Tech
All
Assistive Technology
Communication Aids
ICT
Immersive technology
Tech
purplebutterflysunshine
Tech
How AI supports Special Education
Assistive Technology
AAC abandonment
Immersive technology
Transforming engagement with immersive technology
Resources
CPD and Events
Contact
Newsletter
Subscribe to SEN Magazine
Home
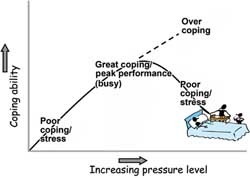
Figure 1. Graph showing the relationship between pressure and coping.
Figure 1. Graph showing the relationship between pressure and coping.
Figure 1. Graph showing the relationship between pressure and coping.